Report: Low-Producing Wells Account for Half of Methane Pollution
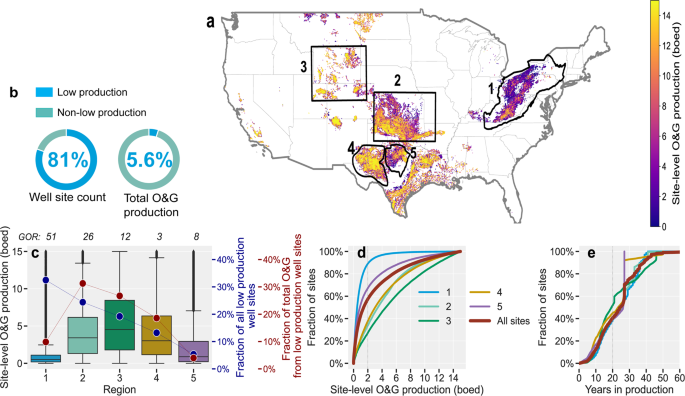
A peer-reviewed study in Nature Communications provided the first nationwide look at how much methane low-producing wells are emitting. While these wells produce just 6% of U.S. oil and gas, they emit HALF of methane pollution from well sites nationwide. “Eighty percent of US oil and natural gas (O&G) production sites are low production well sites, with average site-level production ≤15 barrels of oil equivalent per day and producing only 6% of the nation’s O&G output in 2019,” said an abstract of the report. Read full piece here
Here is another article in Reuters new service
Characteristics of US low production oil and gas well sites.

a Spatial distribution of active onshore low production well sites (n = 565,000) color-coded by site-level O&G production in barrels of oil equivalent per day (boed) per site. The numbered boxes show a few of the major low production well site regions, including those for which site-level CH4 emissions data are available: (1)—Appalachian, (2)—Oklahoma/Kansas/Arkansas, (3)—Colorado/Utah/Wyoming, (4)—Permian Basin, and (5) Barnett Shale. b Distribution of the national number of well sites and O&G production, comparing low production sites with non-low production sites. c Box plots (centerline, median; box limits, upper and lower quartiles; whiskers, 1.5× interquartile range; points, outliers) showing the distribution of site-level O&G production in each of the five O&G production regions with large numbers of low production well sites shown on the map. The average gas-to-oil ratio (GOR, Mcf/barrel) is shown on the top x-axis. These five regions account for three-quarters (76%) and two-thirds (68%) of the total number and O&G production from all low production well sites, respectively. The horizontal lines within each box plot show the median production rate per site. On the right y-axis, the percentage of the total count of low production well sites and total O&G production from all low production well sites are shown in blue and red, respectively. d Cumulative distribution functions of site-level O&G production for all low production well sites (red line) and well sites in each of the regions shown on the map (blue line—Region 1, light green—Region 2, dark green—Region 3, orange—Region 4, purple—Region 5). e Cumulative distribution functions of low production well site age, representing the years in production as of December 31, 2019 and based on the reported first production date. Lines are color-coded as in d. Analysis based on data from Enverus Prism19 for 2019.
